Showing posts with label internet. Show all posts

Sunday, May 24, 2020

Employment changes in Information industries after Covid -19 shutdowns

Post updated June 11, 2020

More than 10 percent of all Information Industry jobs were lost by May, according to preliminary labor department statistics.

There are six Information industries which employed about 2.8 million people in February before stay home orders began. Jobs were lost in all of the six industries.

None of the Information industries gained jobs in May as some stay home orders were relaxed. There were job gains in other sectors such as Construction, Manufacturing, Financial activities, and Retail.

The Motion Picture and Sound Recording industry was hardest hit among Information industries -- more than half of its 456,000 jobs were gone by May.  Five other industries suffered job losses ranging from more than 8 percent in Broadcasting to 0.37 percent in Other Information Services. Other Information includes search engines and digital publishers and broadcasters.

This post describes changes in employment for all six Information industries from May 2019-May 2020. I also report employment in selected occupations as of May, 2019.

The first chart shows aggregate employment in all six industries.


The chart (above) shows monthly changes in Information sector employment. Data from the U.S. Bureau of Labor Statistics is seasonally adjusted to remove the influence of  predictable influences such as seasonal changes or holiday hiring. This provides a more accurate estimate of changes caused by factors like the pandemic.

April and May employment statistics are preliminary and subject to revision.

The six Information industries employed more than 2.8 million people from May 2019-Feb. 2020. The industries had lost an estimated 316,000 jobs by May, a decline of 10.9 percent.

Information is part of the private, nonfarm business sector which employed 129.7 million people in February 2020. The sector had lost an estimated 21 million jobs by April.  Some industries in this sector added jobs in May. But the entire sector was still down 17.9 million jobs since February, a decline of  13.8 percent.

Subsequent charts report employment in each of the six industries.


The second chart (above) shows Other Information Services, which includes search engines, internet-only publishing and broadcasting, and web sites that store and provide information.

Employment increased by 19,000 jobs from May 2019-Feb. 2020. Other Information employed 354,400 people in February. 

The industry added jobs in March. However, Other Information had lost an estimated 1,300 jobs by May, a decrease of 0.37 percent.

The table (below) reports 2019 employment in selected occupations. This is the most recent available data.


Employment in selected occupations is a rough indicator of the relative importance of specific jobs. However, these jobs may not be evenly distributed across the entire industry.

About 6 percent of Other Information employees were in Media occupations in 2019. Half were editors, and less than 2 percent were reporters

Editors may be employed at digital firms that do and do not produce original content. Reporters, however, are concentrated at a small number of digital news publications.

Computer jobs (not shown) are also reported for each industry to provide a comparison. Computer jobs and technology can be used to produce, distribute, and sell media and other information products.  

Computer jobs were 24.2 percent of employment in Other Information in 2019.


The third chart (above) shows Telecommunications, which includes distribution and services for telephones, cable and satellite broadcasting, and internet access.

Employment in Telecommunications decreased by about 16,000 jobs from May 2019-Feb. 2020. The industry employed about 700,000 people in February.

An estimated 12,800 jobs were lost by May, a decrease of 1.8 percent.


Media occupations were less than 1 percent of this industry in 2019. The industry does not produce original media content, so this is expected.

Computer jobs (not shown) accounted for 16.3 percent of employment in Telecommunications.


The fourth chart (above) shows Publishing, which includes newspapers, magazines, books, directories and software publishing. 

Employment in Publishing increased by about 12,000 people from May 2019-Feb. 2020. The industry had 770,000 jobs in February.

An estimated 28,000 jobs were lost by May, a decrease of 3.6 percent.


Media workers were about 10 percent of all Publishing jobs in 2019. Editors were almost 6 percent of industry jobs, probably because editors were employed by magazines and book publishers in addition to newspapers. Reporters were 2.5 percent of the industry, jobs that were concentrated in newspapers.

Computer occupations (not shown) accounted for 31 percent of Publishing jobs in 2019. Computer jobs may be more widely distributed than media jobs in this industry.


The fifth chart (above) shows Data Processing, which includes hosting and providing data processing services.

Employment increased by about 13,000 jobs from May 2019-Feb. 2020. Data Processing employed about 349,000 people in February.

An estimated 9,800 jobs were lost by May, a decrease of 2.8 percent.


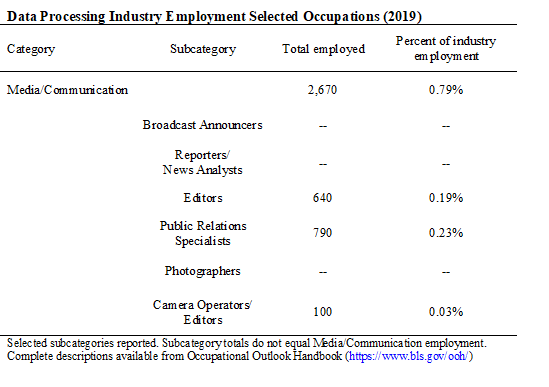
Less than 1 percent of jobs were in Media occupations in 2019. This is another industry that does not produce media content.

Computer jobs (not shown) accounted for 40 percent of Data Processing employment. This is expected because the industry is defined by computing.


The sixth chart (above) shows Broadcasting, an industry that creates, acquires and distributes content via radio, television, cable and other subscription services.

Broadcasting employment decreased by about 4,000 jobs from May 2019-Feb. 2020. The industry employed 263,300 people in February.

Broadcasting lost an estimated 23,000 jobs by May, a decrease of 8.7 percent.


About 21 percent of Broadcasting jobs were in Media occupations in 2019. Broadcast Announcers and Disc Jockeys were 9 percent of all jobs, probably because they were employed by television and radio stations.

Reporters were about 6 percent of all jobs and camera operators and editors were 3.6 percent of jobs, possibly because these were concentrated at television stations.

Computer jobs (not shown) accounted for just 4.8 percent of Broadcasting employment in 2019.


The seventh chart (above) shows Motion Picture and Sound Recording, which includes the production and distribution of motion pictures and sound recordings.

Employment was steady at about 450,000 people until February 2020. 

The industry lost an estimated 240,900 jobs by May, or about 52.7 percent.

This unusually large decline may result from collaboration between many people in the same place when making a movie or a recording. Covid-19 makes physical proximity dangerous.


Only 3.5 percent of Motion Picture and Sound jobs were in Media occupations in 2019.

Camera operators and editors were listed as a major category, accounting for another 3.5 percent of all jobs. There were more than twice as many camera operators and editors, 27,560, as in Broadcasting with 9,690. 

Computer jobs (not shown) were just 1.5 percent of employment in Motion Pictures and Sound.

Comments

Employment changes during the pandemic are probably influenced by whether employees can keep working, how much demand and revenue still exists for the industry's products, and long-term employment trends.

The pandemic is having the smallest effect on Other Information Services. This may be because employees can work from home. This may also result from increased demand for internet services when millions of people were ordered to stay home as much as possible. Online advertising is generally cheaper than ads in Broadcasting or Publishing, so increased demand also means the industry can continue selling ads.

Smaller adverse effects on employment also appear in other industries where technology may allow people to work from home, such as Data Processing and Telecommunications. However, both industries employ thousands of sales agents who may be unable to work. Telecommunications demand for cell phone services may also be affected if customers are losing their jobs and incomes.

Publishing jobs losses are increasing. Some employees may be able to work from home such as book and magazine editors and computer employees. Employment in Publishing as a whole was also increasing before the pandemic.

However, some Publishing sectors such as newspapers had decreasing employment before the pandemic. The initial pandemic response from some large newspaper companies included cutting hours worked and using furloughs to avoid layoffs. But these are interim measures that might not be enough to stave off layoffs.

The largest adverse effects appear to be industries where workers must gather in the same location to produce news and entertainment products. Broadcasting is also losing advertising revenue because large advertisers are reducing spending as consumers buy fewer advertised products.

Most dramatically, Motion Picture and Sound Recording jobs vanished as the production of movies and television programs shut down.

Wednesday, May 7, 2014

Glimpse of Tumblr is reminder new media business model isn't generating many jobs

There is still a lot we don’t know about the new media business model, so even a glimpse of the model’s inner workings can be valuable. A New York Times article about Tumblr offers such a glimpse, which shows the company is unlikely to generate a significant number of media jobs.
 
There is a great deal of fascination about companies like Tumblr, a popular blogging platform that Yahoo purchased last year for a reported $1.1 billion, mostly cash. Tumblr wasn’t profitable, but Yahoo did acquire millions of Tumblr bloggers to add to Yahoo’s user base. Yahoo is developing ways to distribute advertising aimed at Tumblr users.
 
Tumblr, like other new media companies, has some superficial similarities to traditional media companies. Both new and traditional media publish content that attracts an audience, then sell advertisers access to that audience. But the similarities end there.
 
New media companies like Tumblr don’t pay for the content - blog posts (including pornography) – they need to exist. Traditional media companies do pay for content, which increases their production costs.
 
New media companies like Tumblr also rely on automation -- computers and computer software --to provide a platform for the production and distribution of the content they use. Traditional media companies cannot easily develop similar platforms because millions of potential users have already selected new media platforms for blogging and other Internet activities.
 
The new media business model relies on free content and automation to keep costs low, otherwise these companies would go out of business. That is because new media companies generate very small per-unit revenue from Internet advertising. These companies must keep their per-unit costs low if they want to generate enough money to survive.
 
The Times article reports that Tumblr doubled its staff, but still employs only 220 people. As of today, Tumblr claims it has 185 million blogs. That is about 841,000 blogs for each employee. If Tumblr expands to 500 employees, it will have 370,000 blogs for each employee. Even if activity on the blogs varies, these numbers show the kind of astonishing productivity that new media companies enjoy because of their reliance on automation.
 
The low per-unit revenue at new media companies means they must also attract a very large number of users before they can generate enough profit to justify the high values that new media companies receive from financial markets. Traditional media companies have much lower values in financial markets, but traditional media still generate high enough revenue-per-unit to survive without an audience in the hundreds of millions.
 
For example, Tumblr’s enormous number of blogs means it has to generate average revenue-per-blog of just $5.95 to match its $1.1 billion purchase price.
 
However, Tumblr still isn’t generating enough revenue to develop “a working business model” according to The Times. (Yahoo hasn’t broken out figures for Tumblr in Yahoo’s most recent financial reports).
 
Yahoo is still trying to develop advertising that won’t disturb the Tumblr ethos, which rejects advertising. I suspect Yahoo is also developing ways to generate revenue from data about Tumblr users even though Yahoo only requires an e-mail address to identify each Tumblr user.
 
This suggests one more thing the glimpse tell us about the new media business model. Small per-unit revenue means these companies require enormous numbers of users to generate enough revenue to become profitable. But sometimes, even a large number of users and a very small number of employees won’t be enough for a new media company to become profitable.

Wednesday, April 16, 2014

Twitter's purchase of data firm an example of a new kind of media competition

I’ve been expecting Twitter to assert more control over the enormous volume of data generated by its users because the data can be sold to businesses, government agencies and academics. Yesterday, Twitter took a notable step to assert that control when it announced the purchase of Gnip, a company that packages and sells data generated from more than 500 million Tweets that are posted each day.

Twitter was losing money when it began selling stock last November, so Twitter has to show investors that it’s doing everything possible to make a profit. Twitter vice-president Jana Messerschmidt explained why Gnip will help Twitter generate new revenue:

“Every day Twitter users share and discuss their interests and what’s happening in the world. These public Tweets can reveal a wide variety of insights — so much so that academic institutions, journalists, marketers, brands, politicians and developers regularly use aggregated Twitter data to spot trends, analyze sentiment, find breaking news, connect with customers and much more.”
 
Twitter also generates revenue by selling advertising. But Twitter knows that we are at the beginning of a data analysis revolution that already generates valuable insights for “hundreds of clients” in business, government, the media, and academe. Those clients will now be paying Twitter for access to Tweets and the analytical tools developed by Gnip.
 
Twitter is under particular pressure from investors to generate revenue because the initial price of its stock rose to levels that some analysts considered too high for a company that was losing money.

But I suspect investors paid those high prices because they believe Twitter is likely to be one of three companies –Google and Facebook are the other two - that will dominate Western Internet markets for information and advertising. When a small number of companies dominate a market, those companies may have pricing power – they can increase prices far above production costs to generate high profits.[1]

One way for Twitter to reassure investors is to take steps that rapidly increase revenue, which is why I expected the company to assert more control over the valuable data on its network. Investors apparently viewed yesterday’s announcement the same way – Twitter’s stock price increased over 11 percent, which Reuters called the largest stock price increase since the company went public.

Gnip is not the only company that purchased access to Tweets and then re-sold them to its clients. Twitter’s statement did not specify how its relationship with other Twitter data providers might change.

However, it’s unlikely that independent Twitter data providers will be allowed to compete away a significant share of the revenue that Twitter gains from purchasing Gnip. At the same time, it will be interesting to see if Gnip continues to offer data from Tumblr, which is owned by Yahoo.

Media companies have always competed for audiences and advertising. Twitter’s purchase of Gnip is an example of a new kind of media competition. The new prize is an endless stream of raw information detailing the characteristics, behavior and preferences of millions of people who use the company’s products.

[1] An oligopoly exists if a company can set a price above its costs, but must then account for the reaction of rival companies in the same market. This makes it possible for companies to earn economic rents, which are profits above the level of returns that could be earned from comparable investments elsewhere. However, economic rents are not assured. A rival firm might offer advertising and information at lower prices, triggering a price competition that ends when prices are just high enough to cover production costs.

Monday, April 14, 2014

Pulitzer Prizes an occasion to consider relationship of newspaper quality to economic success


The Pulitzer Prizes announced today offer a chance to consider three studies of the links between journalistic quality and economic success. The Pulitzers, newspaper journalism’s most prestigious awards for excellence, go to a small number of newspapers and websites each year.
 
Brian Logan and Daniel Sutter found newspapers that had won Pulitzer Prizes also had “significantly higher circulation [than newspapers without Pulitzers], even when controlling for the economic and demographic characteristics and media competition of the metropolitan area” where the newspaper circulated.
 
Publishers will only spend money to produce prize-winning journalism if the journalism pays for itself by increasing circulation and generating extra revenue. Increases in circulation at Pulitzer winning papers were probably large enough to generate that extra revenue, the study concluded.
 
Logan and Sutter argued that Pulitzer Prizes are an important “signal of quality” for consumers. News is what economists call a credence good. Consumers cannot evaluate the true quality of a credence good even after they have consumed the good. For example, consumers have no way to tell if the information in a news article is accurate. This forces consumers to evaluate quality based on a newspaper’s reputation, including the prizes it has won.

This was a careful study, but it used circulation data from 1997. We need newer studies that account for the shift of audiences to the Internet before we can be sure the Pulitzers are still associated with significantly larger audiences. The second and third studies are from a line of research that examines the overall quality of news instead of focusing on Pulitzer Prizes.
 
These studies  use the financial commitment model. This model states newspapers facing competition will increase their newsroom spending, or financial commitment to news. Increased spending results in a larger newspaper staff and/or an increase in the variety and depth of news that is published. As the quality of news increases, consumers receive more utility from reading the newspaper. This in turn leads to increases in the newspaper’s circulation and/or advertising revenues.
 
In the second study Stephen Lacy and I reviewed decades of research that supports the financial commitment model. We focused on newspaper reactions to declines in circulation as readers and advertisers shifted to news published on the Internet.
 
Papers might use any of three strategies to maintain profits when circulation declines. First, newspapers might try to offset circulation declines by increasing advertising prices. Second, newspapers might leave ad prices unchanged, which amounts to an increase since advertisers are paying to reach fewer readers. Third, newspapers might cut their newsroom costs and reduce the quality of their news.

We concluded newspapers that raised ad prices or reduced quality would probably accelerate the loss of circulation. However, newspapers that published quality content might stabilize or slow declines in circulation.


The third study had unusual access to 12 years of  internal revenue and circulation data from an individual newspaper. The study looked at newsroom spending, subscription revenue, and advertising revenue from the print and online editions of the newspaper.
 
The study used subscription revenue instead of circulation because advertisers value subscribers more than they value readers who don’t pay for the paper. Subscribers are more likely to read the paper carefully and register advertising messages, argued authors Yihui Tang, Shrihari Sridhar, Esther Thorson and Murali K. Mantrala.
 
Results showed increased newsroom spending resulted in increased subscriptions to the newspaper.  The subscription increases then resulted in increased print and online advertising revenues. A simulation showed opposite effects – reductions in newsroom spending could lead to reductions in subscriptions, resulting in reductions in both online and print advertising revenues.
 
These last two studies accounted for the Internet. However, the three studies are just a beginning.
 
Many newspapers still rely on print editions to generate the bulk of their advertising and subscription revenues. Online revenue is a distant second when it comes to generating profits. More empirical research is needed to produce additional recommendations that can help newspaper managers who are trying to survive in this difficult environment.

Friday, April 11, 2014

Late night TV replacement hosts were selected to avoid declines in audience ratings


Creating a network television schedule is similar to assembling a portfolio of financial investments, according to a useful paper by the late Barry R. Litman and Seema Shrikhande and Hoekyun Ann. Like investors who try to balance financial returns from different investments, network programmers try to balance the audience size for different programs.
The goal is to build an audience that attracts local and national advertisers throughout an entire evening of television programs.
Network programmers assemble a portfolio of programs that is designed to minimize risk, the study concludes. Risk can be measured by the variation in audience size from one program to the next. Programmers try to minimize risk by minimizing the variation in audience size.1
Efforts to minimize risk are particularly apparent when new programs are created. Programmers try to select new programs that will attract audiences that are similar in size to the audiences for the network's existing programs, the study says.
This desire to avoid failure can be seen in the selection of replacements for late night hosts Jay Leno at NBC and David Letterman at CBS. Leno has been replaced by comedian Jimmy Fallon. Letterman, who will retire in 2015, will be replaced by comedian and satirist Stephen Colbert.
These replacements represent the continuation of a decades-long strategy featuring late-night hosts who are white, male, and offer a reliable mix of stand-up comedy and interviews. This strategy still draws a combined late-night audience for NBC and CBS of more than 6 million viewers.

It’s not surprising that neither network wants to experiment with a host who doesn’t fit the established conventions for the 11.30 p.m. timeslot. Programmers at both networks surely recall how audience ratings at NBC declined in 2010 when it briefly replaced Jay Leno with Conan O’Brien.

Audiences for local television newscasts are influenced by the late night shows that follow those newscasts. So programmers must also try to avoid changes that could cause declines in the audience for local news, which is a critical source of advertising revenue at television stations throughout the U.S.
Jimmy Fallon and Stephen Colbert seem like safe choices that will help the networks avoid a loss of audience. Both replacements combine an appeal to younger audiences with a sensibility that seems unlikely to alienate older viewers. (Objections to Colbert made by politically conservative commentators will fade into irrelevance if, as expected, Colbert drops his persona as a political satirist when he arrives at CBS.)
But I wonder how long these safe programming choices will continue to work for late night television. This has nothing to do with reaching audiences who would rather watch these programs on the Internet. Both replacement hosts and both networks are adept at producing material for the Internet.
Meanwhile, the demographics of the country are rapidly and inevitably changing. States like California, where the combined minority population outnumbers the white population, represent the future. Will Fallon and Colbert have the same long-term audience appeal that their predecessors enjoyed?  Or will changing audience preferences undermine the safe choices made by network programmers?
1 A portfolio is used to balance risks. A program with large variations in audience size has a large risk. If the programs has an unusually large audience, the risk is rewarded with increased advertising revenue. But if the program has an unusually small audience, ad revenues will also be small. Programmers could use programs that consistently attract larger audiences to balance the risk of adding programs that might result in smaller audiences. But the study found programmers are reluctant to include risky programs in their portfolios. Programmers create portfolios to minimize the variation in audience size, which minimizes any instability in their ability to generate ad revenues.  

Sunday, April 6, 2014

Coordination costs can make it difficult to create synergies at media firms

Media firms have for years tried to reduce their costs by centralizing the production and marketing of a variety of content. But the cost of coordinating centralized activities can be considerable, large enough in some cases to offset the savings that firms hope to realize.
 
For example, firms that own multiple newspapers have for decades tried to reduce costs by centralizing the production of news or centralizing administrative tasks. Efforts to centralize news production have also been extended to newspaper websites and mobile editions.
 
However, centralization can be difficult to coordinate if individual newspapers use different computer systems or software to manage and publish their digital editions.
 
Technically, these companies are trying to create economies of scope, colloquially known as “synergies.” Economies of scope exist when the joint production of two or more products is cheaper than producing the products separately. 
 
Technically, it’s also much easier to say you are creating economies of scope than it is to actually reduce costs this way. The successful creation of economies of scope often requires that a firm re-arrange details of the production process.
 
If, for example, a multi-media news story is distributed to multiple papers with different publishing software, the story might have to be re-formatted for compatibility with each individual paper’s software.
 
Media firms are also trying to collect and analyze data about how audiences interact with the firms' web sites and mobile applications. This kind of analysis might also be expensive to coordinate if different websites use different measurements or data collection techniques. Trying to reconcile differences in the ways that numbers are collected can be a lengthy, frustrating and sometimes impossible task.
 
Firms might have to make significant capital expenditures to eliminate inconsistent software or other internal barriers to coordination. Some newspaper companies are buying or creating new software platforms for distributing digital news and advertising. Some of these initiatives may be intended to resolve coordination issues, if so that is a hopeful sign.
 
Problems coordinating activities inside a media firm are not likely to draw much attention outside these firms. But there is a reason multiple economists have won Nobel Prizes for examining coordination costs (here, here and here).
 
Media firms that centralize internal activities to save time and money will find it worthwhile to include coordination costs in their analysis of what it takes to make those efforts work.

Thursday, April 3, 2014

Shifting production to the Internet creates new problems that newspapers must solve


As newspapers shift from print to the Internet, they are hoping to significantly reduce production costs. These companies are trying to offset declines in advertising revenue by reducing the amount they spend on printing presses, newsprint and delivery trucks.

But the benefits of this change are not guaranteed. Reducing offline production costs is a complex problem to solve.

Most of the industry’s advertising revenue – about $21.8 billion in 2012 – still comes from print publications. So newspapers must maintain that revenue source at the same time they are moving to the Internet.

Production costs might be lower on the Internet, but they are not zero. Newspapers must pay for websites and mobile applications. But Internet advertising and other digital sources accounted for just 11 percent of the industry’s total revenue in 2012.[1] Newspapers also face significant competition from digital firms for online revenue.

To make the transition succeed, newspaper companies must keep digital production costs low enough to be competitive and attract enough online revenue to cover those costs. Meanwhile, the companies must continue to produce the print products that generate the bulk of their revenue for as long as those products remain profitable.

And economic survival isn’t likely to get easier for newspaper companies that do leave print behind. Those firms will have to manage new kinds of competition.
There was an important reminder this week of just how difficult the transition can be. Digital First Media, which owns 75 newspapers, has a strategy of moving quickly away from print to digital distribution on the Internet.

One high-profile piece of the Digital First strategy has now failed. The company is closing a centralized newsroom that used digital production to provide national stories for its newspapers across the U.S.  Rick Edmonds notes the failure is a valuable reminder that even digital news production is expensive:


It is myth, embraced by digital future-of-news enthusiasts, that Web publishing is close to free. [Digital First CEO John] Paton seemed of that view early in his tenure when he asked newsrooms to use mainly free tools to put out their reports for a week. 

But in his most recent manifesto/speech to the Online Publishers Association in January, he said he was looking for another $100 million to invest in the company’s digital activities on top of an earlier $100 million. 

Digital First is a private company, so it's hard to tell what the implications are for other newspaper companies. There is reason to be cautious because Digital First has complex finances – it was created by merging two other companies that had both been gone through bankruptcy. A hedge fund is a major investor, and that fund may be looking for a quick return on its investment.

Other companies with stronger finances or different investors might have more flexibility in managing the transition from print to digital. But it won’t be easy for any company to do.


[1] An estimated $4.2 billion of $38.6 billion in total industry revenue according to the Newspaper Association of America.

Tuesday, April 1, 2014

Some reasons digital media probably won't offset the decline in traditional journalism jobs

The long-term decline in journalism jobs appears quite serious because Internet-based firms don’t have a business model that can generate enough new jobs to replace the jobs that are being lost.

The Pew Research Center's Journalism Project recently weighed in on this issue, providing new information about the number of journalists employed at Internet firms. The data in the Pew report are limited, but they are in line with what we know about Internet business models.
 
Internet business models are not designed to support many jobs
 
The largest Internet firms – search engines and social media – use a micropayment system to generate small amounts of advertising revenue for each unit of production. Google makes pennies on each search result it delivers. Facebook and Twitter make a few dollars per year from each of their millions of members (these firms produce information about members that is used to target ads).
 
So Internet firms must keep their production costs low if they want to remain in business. These firms rely on automation – high speed computers and Internet connections – to deliver ads and information to their users. The firms also keep costs low with free access to the content that they index or display. Internet firms could not afford to pay for the content they need even if they wanted to.
 
Journalism firms that rely on Internet advertising revenue will have to charge the going rate, which means those firms must also rely on micropayments. So Internet-only journalism firms will probably only hire small numbers of journalists.
 
The Pew findings are in line with this expected outcome. Pew surveyed what it called 438 small digital news outlets focused on local coverage and found “an average of 4.4 jobs per outlet.”

The report also examined large digital organizations, some with national and international audiences, and the findings were striking. Only five of 29 large organizations[1] employ more than 100 journalists. Another six organizations employ 70 or 50 staffers, and the remaining 18 organizations employ fewer than 50 journalists.

Unfortunately, the Pew report did not include information about wages or the markets where the digital organizations operate. The report did not attempt even simple comparisons between digital and traditional media firms such as the number of journalists for a given audience size.
 
Comparisons would have been helpful because traditional media such as newspapers and television stations still employ the bulk of journalists in the U.S. Traditional firms don’t (yet) operate on a micropayment model. These firms still have substantial advertising or circulation revenue from their print and broadcast editions.
 
Some trends in markets for journalism jobs
 
So what are the current trends in jobs at traditional and digital media organizations?  A complete answer is beyond the scope of this post. However, I’ve examined trends for one important category of journalism jobs to illustrate how we might begin to answer these questions.
 
The category is employment of reporters and correspondents in the U.S. Reporters play a vital role by gathering raw information that is used to produce news stories. These statistics are from the Bureau of Labor Statistics, here and here,  and don’t include editors, photographers, or newsroom managers.

Bureau of Labor Statistics Reporters and Correspondents in the U.S.
 
2008
 
2013
Difference
Pct. Difference
Total employment
50,960
 
43,630
−7,330
−14.3%


Nominal avg. wage
$44,030
 
$44,360
$330
0.7%


Inflation adjusted (2008)
$44,030
 
$40,998
−$3,032
−6.8%

The illustration begins in 2008, the year after the recession hit and advertising revenue at traditional media organizations went into a steep decline. The illustration ends six years later in 2013, when a sluggish recovery from the recession was well underway.
 
This first table shows the 2008 total of 50,960 reporters declined by 14.3 percent in those six years.  The average annual wage of $44,030 in 2008 increased by just $330 in those six years. I converted the 2013 wage to inflation-adjusted 2008 dollars, and the result shows that real wages actually declined by 6.8 percent.
 
Declining real wages are exactly what you would expect in a profession where employment is declining.
 
Reporters and Correspondents at Newspapers, Periodical, Book and Directory Publishers
 
2008
 
2013
Difference
Pct. Difference
Total employment
37,500
 
27,420
−10,080
−26.8%


Nominal  avg. wage
$40,560
 
$40,240
−$320
−0.8%


Inflation adjusted (2008)
$40,560
 
$37,190
−3,370$
−8.3%

The second table shows the number of reporters working at newspapers, periodicals and other publishers. There was a 26.8 percent decline in the number of reporters in this category from 2008 to 2013. Nominal wages also declined by $320 a year. After adjusting for inflation, real wages declined by 8.3 percent.

Here again, a decline in real wages is expected because of the significant decline in the number of jobs. The decrease in jobs probably resulted from declines in newspaper and periodical circulation and advertising revenues.
 
Reporters and Correspondents in Radio & Television Broadcasting
 
2008
 
2013
Difference
Pct. Difference
Total employment
9,670
 
10,370
700
7.2%


Nominal avg. wage
$51,410
 
$48,110
−$3,300
−6.4%


Inflation adjusted (2008)
$51,410
 
$44,464
−$6,946
−13.5%

This third table shows reporters working in radio and television broadcasting. There was a 7.2% increase in the number of reporters employed. However, the absolute increase was small – just 700 new jobs in six years – and did not result in an increased wages. Instead, real wages declined by 13.5%.

Why did wages for radio and television decline when the number of jobs increased?
 
One possibility is supply and demand.  We know, for example, that the supply of journalism graduates seeking television jobs far exceeds the demand.  Another possibility is that broadcasters adjusted to declines in ad revenue by laying off expensive older workers and hiring inexpensive younger workers to replace them.
 
However, there is not enough information in the table to be sure what the cause might be.
 
Reporters and Correspondents Other Information Services.
 
2008
 
2013
Difference
Pct. Difference
Total employment
1,830
 
3,910
2,080
113%


Nominal avg. wage
$71,200
 
$57,830
$−13,370
−18.7%


Inflation adjusted (2008)
$71,200
 
$53,447
−$17,753
−24.9%


The fourth table shows reporters working for “Other Information Services.” This broad category with 242 occupations includes computer programmers and web developers. So this may include reporters working for digital firms.

Jobs in this category increased by 113% in six years. The percentage is high because the 2008 base of 1,830 jobs was small, and the actual increase is just 2,080 jobs.
 
Despite the rapid job growth, both nominal and real wages decreased dramatically from 2008 to 2012. Real wages declined from $71,200 a year to just $53,447 a year, a decrease of 24.9 percent.
 
The decrease in wages might be due to the small number of jobs in 2008. Perhaps these jobs were concentrated in high wage areas, and new jobs were added in less expensive areas.
 
Another possibility is that demand for these jobs is growing so fast it outstripped supply. The Pew report has anecdotal accounts of hundreds or thousands of applications for a single job at a digital firm.  If this is typical, it would drive wages down.
 
Again, the table doesn’t offer enough information to figure out the cause.

I think this illustration shows three important results.  First, almost all of the overall decline in reporting jobs is accounted for by one category - newspapers and other publishers.[2] Second, there is downward pressure on wages even in categories with minimal or strong job growth. Third, growth in the other information category still falls far short of replacing the jobs that are being lost.
 
Meanwhile, the Bureau of Labor Statistics projects continued declines in the number of reporters and correspondents, stating there will be 14 percent fewer jobs by 2022.

 
[1] I did not include one firm on the Pew list, Vice, because its staffing includes journalists and non-journalists. Vice has the largest staffing number, 1,100, which means job totals in the Pew report may have an upward bias.
[2] Two small reporter categories, each  with fewer than 700 jobs, were not included this analysis.