Showing posts with label broadcasting. Show all posts

Friday, July 3, 2020

Information industry jobs changes are mixed as economy re-opens from Covid-19

Three of the six information industries gained jobs in June and job losses slowed in the other three industries, according to preliminary labor department statistics.

Total employment in all six Information industries is still about 11 percent less than it was in February before stay home orders began. The six industries, which employed about 2.9 million people in February, had lost about 315,000 jobs by June.

However, the June jobs report is the first indication that some Information industries may be joining the recovery from the pandemic that began last month for sectors like Construction and Retail.

This post describes changes in employment for all six Information industries from June 2019-June 2020. The post does not include employment in selected occupations, which can be found in last month's post on Information jobs.

The first chart shows aggregate employment in all six industries.


The chart (above) shows monthly changes in Information sector employment. Data from the U.S. Bureau of Labor Statistics is seasonally adjusted to remove predictable influences such as seasonal changes or holiday hiring. This provides a more accurate estimate of changes from factors like the pandemic.

May and June employment statistics are preliminary and subject to revision.

The six Information industries employed more than 2.8 million people from June 2019-Feb. 2020. The industries lost jobs in March, April, and May before a small recovery in June.

June 2020 Information employment was still an estimated 315,000 jobs lower than in Feb. 2020, a decline of 10.9 percent. The Information sector employed an estimated 2.57 million people in June. 

Information is part of the private, nonfarm business sector which employed 129.7 million people in February 2020. The sector lost an estimated 21 million jobs in April, then added jobs in May and June. However, in June the sector was still down 13.1 million jobs since February, a decline of  10.2 percent.

Subsequent charts report employment in each of the six Information industries.


The second chart (above) shows employment in Data Processing, which includes hosting and providing data processing services.

Data Processing had the largest employment increase from May to June, adding an estimated 5,600 jobs. Employment is now 345,500, which is still below the 349,600 jobs in February.

Total job losses since February are estimated to be 4,100, a decrease of 1.2 percent.


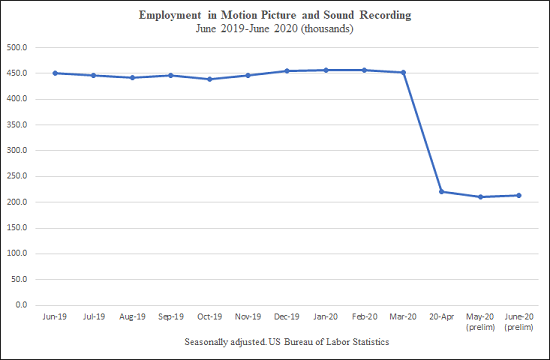
The third chart (above) shows Motion Picture and Sound Recording, which includes the production and distribution of motion pictures and sound recordings.

This industry had the second largest employment gain from May to June, adding an estimated 2,600 jobs. However, employment was still far below the February figure of 456,000. 

Motion pictures and sound lost an estimated 243,700 jobs by June, or about 53.4 percent.

This unusually large decline may result from requirements that many people work in the same place when making a movie or a recording. Covid-19 makes physical proximity dangerous.


The fourth chart (above) shows Other Information Services, which includes search engines, internet-only publishing and broadcasting, and web sites that store and provide information.

This industry had the third largest employment gain from May to June, adding about 2,200 jobs.

Other Information jobs increased from February to March, before declining in April and May. Employment is still below the peak in March.

However, June's estimated employment figure is 1,200 higher than than the 354,400 jobs in February, an increase of 0.34 percent.


The fifth chart (above) shows Publishing, which includes newspapers, magazines, books, directories and software publishing. 

Job losses slowed in in June when the industry lost an estimated 600 jobs, the largest monthly loss in the Information sector.

Publishing had 770,000 jobs in February and lost an an estimated 30,700 jobs by June, a decrease of 3.9 percent.


The sixth chart (above) shows Telecommunications, which includes distribution and services for telephones, cable and satellite broadcasting, and internet access.

Employment losses in Telecommunications also slowed, an estimated decrease of 300 jobs in June was the second largest monthly loss in Information. 

The industry employed about 700,000 people in February. Telecommunications employment was down 12,400 June, an estimated decrease of 1.8 percent.


The seventh chart (above) shows Broadcasting, an industry that creates, acquires and distributes content via radio, television, cable and other subscription services.

Broadcasting employment decreased by an estimated 200 jobs in June, the smallest monthly loss in the Information sector.

The industry employed 263,300 people in February. Broadcasting lost an estimated 25,000 jobs by June, a decrease of 9.5 percent.

Comments

The pandemic continues to have the smallest effect on employment in Other Information Services, which may have two advantages. First, many employees can work from home. Second, there was increased demand for internet services as millions of people were ordered to stay home as much as possible. 

The June increase in Data Processing jobs is consistent with continued or increased demand for technology-based products and services. Job losses in Telecommunications continued in June, perhaps because the widespread loss of income during the pandemic reduced demand for telephone and cable services.

Motion Picture and Sound Recording remains the hardest hit industry despite the gain of 2,600 jobs in June. This change is too small to say if the large-scale production of movies, television programs and recordings is starting to resume.

Publishing and broadcasting job losses slowed, but these industries did not recover in June.

Sunday, May 24, 2020

Employment changes in Information industries after Covid -19 shutdowns

Post updated June 11, 2020

More than 10 percent of all Information Industry jobs were lost by May, according to preliminary labor department statistics.

There are six Information industries which employed about 2.8 million people in February before stay home orders began. Jobs were lost in all of the six industries.

None of the Information industries gained jobs in May as some stay home orders were relaxed. There were job gains in other sectors such as Construction, Manufacturing, Financial activities, and Retail.

The Motion Picture and Sound Recording industry was hardest hit among Information industries -- more than half of its 456,000 jobs were gone by May.  Five other industries suffered job losses ranging from more than 8 percent in Broadcasting to 0.37 percent in Other Information Services. Other Information includes search engines and digital publishers and broadcasters.

This post describes changes in employment for all six Information industries from May 2019-May 2020. I also report employment in selected occupations as of May, 2019.

The first chart shows aggregate employment in all six industries.


The chart (above) shows monthly changes in Information sector employment. Data from the U.S. Bureau of Labor Statistics is seasonally adjusted to remove the influence of  predictable influences such as seasonal changes or holiday hiring. This provides a more accurate estimate of changes caused by factors like the pandemic.

April and May employment statistics are preliminary and subject to revision.

The six Information industries employed more than 2.8 million people from May 2019-Feb. 2020. The industries had lost an estimated 316,000 jobs by May, a decline of 10.9 percent.

Information is part of the private, nonfarm business sector which employed 129.7 million people in February 2020. The sector had lost an estimated 21 million jobs by April.  Some industries in this sector added jobs in May. But the entire sector was still down 17.9 million jobs since February, a decline of  13.8 percent.

Subsequent charts report employment in each of the six industries.


The second chart (above) shows Other Information Services, which includes search engines, internet-only publishing and broadcasting, and web sites that store and provide information.

Employment increased by 19,000 jobs from May 2019-Feb. 2020. Other Information employed 354,400 people in February. 

The industry added jobs in March. However, Other Information had lost an estimated 1,300 jobs by May, a decrease of 0.37 percent.

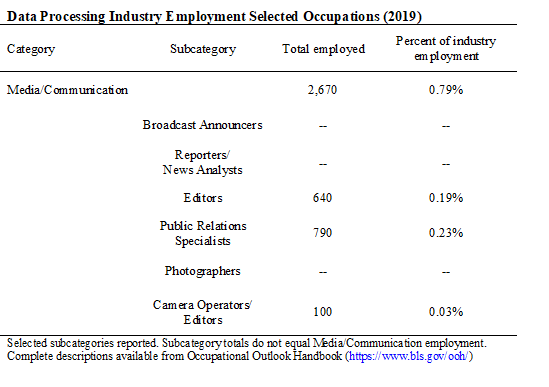
The table (below) reports 2019 employment in selected occupations. This is the most recent available data.


Employment in selected occupations is a rough indicator of the relative importance of specific jobs. However, these jobs may not be evenly distributed across the entire industry.

About 6 percent of Other Information employees were in Media occupations in 2019. Half were editors, and less than 2 percent were reporters

Editors may be employed at digital firms that do and do not produce original content. Reporters, however, are concentrated at a small number of digital news publications.

Computer jobs (not shown) are also reported for each industry to provide a comparison. Computer jobs and technology can be used to produce, distribute, and sell media and other information products.  

Computer jobs were 24.2 percent of employment in Other Information in 2019.


The third chart (above) shows Telecommunications, which includes distribution and services for telephones, cable and satellite broadcasting, and internet access.

Employment in Telecommunications decreased by about 16,000 jobs from May 2019-Feb. 2020. The industry employed about 700,000 people in February.

An estimated 12,800 jobs were lost by May, a decrease of 1.8 percent.


Media occupations were less than 1 percent of this industry in 2019. The industry does not produce original media content, so this is expected.

Computer jobs (not shown) accounted for 16.3 percent of employment in Telecommunications.


The fourth chart (above) shows Publishing, which includes newspapers, magazines, books, directories and software publishing. 

Employment in Publishing increased by about 12,000 people from May 2019-Feb. 2020. The industry had 770,000 jobs in February.

An estimated 28,000 jobs were lost by May, a decrease of 3.6 percent.


Media workers were about 10 percent of all Publishing jobs in 2019. Editors were almost 6 percent of industry jobs, probably because editors were employed by magazines and book publishers in addition to newspapers. Reporters were 2.5 percent of the industry, jobs that were concentrated in newspapers.

Computer occupations (not shown) accounted for 31 percent of Publishing jobs in 2019. Computer jobs may be more widely distributed than media jobs in this industry.


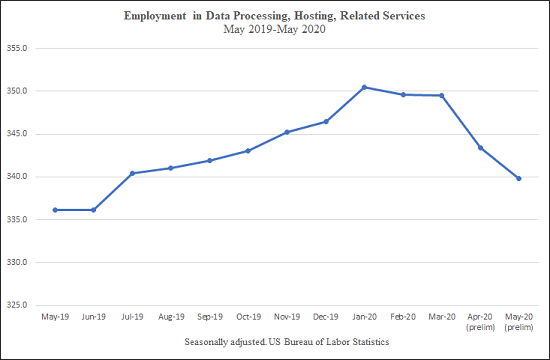
The fifth chart (above) shows Data Processing, which includes hosting and providing data processing services.

Employment increased by about 13,000 jobs from May 2019-Feb. 2020. Data Processing employed about 349,000 people in February.

An estimated 9,800 jobs were lost by May, a decrease of 2.8 percent.


Less than 1 percent of jobs were in Media occupations in 2019. This is another industry that does not produce media content.

Computer jobs (not shown) accounted for 40 percent of Data Processing employment. This is expected because the industry is defined by computing.


The sixth chart (above) shows Broadcasting, an industry that creates, acquires and distributes content via radio, television, cable and other subscription services.

Broadcasting employment decreased by about 4,000 jobs from May 2019-Feb. 2020. The industry employed 263,300 people in February.

Broadcasting lost an estimated 23,000 jobs by May, a decrease of 8.7 percent.


About 21 percent of Broadcasting jobs were in Media occupations in 2019. Broadcast Announcers and Disc Jockeys were 9 percent of all jobs, probably because they were employed by television and radio stations.

Reporters were about 6 percent of all jobs and camera operators and editors were 3.6 percent of jobs, possibly because these were concentrated at television stations.

Computer jobs (not shown) accounted for just 4.8 percent of Broadcasting employment in 2019.


The seventh chart (above) shows Motion Picture and Sound Recording, which includes the production and distribution of motion pictures and sound recordings.

Employment was steady at about 450,000 people until February 2020. 

The industry lost an estimated 240,900 jobs by May, or about 52.7 percent.

This unusually large decline may result from collaboration between many people in the same place when making a movie or a recording. Covid-19 makes physical proximity dangerous.


Only 3.5 percent of Motion Picture and Sound jobs were in Media occupations in 2019.

Camera operators and editors were listed as a major category, accounting for another 3.5 percent of all jobs. There were more than twice as many camera operators and editors, 27,560, as in Broadcasting with 9,690. 

Computer jobs (not shown) were just 1.5 percent of employment in Motion Pictures and Sound.

Comments

Employment changes during the pandemic are probably influenced by whether employees can keep working, how much demand and revenue still exists for the industry's products, and long-term employment trends.

The pandemic is having the smallest effect on Other Information Services. This may be because employees can work from home. This may also result from increased demand for internet services when millions of people were ordered to stay home as much as possible. Online advertising is generally cheaper than ads in Broadcasting or Publishing, so increased demand also means the industry can continue selling ads.

Smaller adverse effects on employment also appear in other industries where technology may allow people to work from home, such as Data Processing and Telecommunications. However, both industries employ thousands of sales agents who may be unable to work. Telecommunications demand for cell phone services may also be affected if customers are losing their jobs and incomes.

Publishing jobs losses are increasing. Some employees may be able to work from home such as book and magazine editors and computer employees. Employment in Publishing as a whole was also increasing before the pandemic.

However, some Publishing sectors such as newspapers had decreasing employment before the pandemic. The initial pandemic response from some large newspaper companies included cutting hours worked and using furloughs to avoid layoffs. But these are interim measures that might not be enough to stave off layoffs.

The largest adverse effects appear to be industries where workers must gather in the same location to produce news and entertainment products. Broadcasting is also losing advertising revenue because large advertisers are reducing spending as consumers buy fewer advertised products.

Most dramatically, Motion Picture and Sound Recording jobs vanished as the production of movies and television programs shut down.

Monday, January 5, 2009

Remembering Barry Litman, who died Dec. 26

Prof. Barry Litman used to sit quietly in meetings of my dissertation committee, holding a document I had labored over for days, waiting for his turn. He always began with a few introductory questions to be sure I understood what was coming next -- a single, penetrating query that would send me back to the library to spend hours digging through books and journal articles in search of an answer.

The result was always the same. I learned something, usually more than just one thing, that was important and useful. Barry Litman made my work better. It wasn't just me. He made everyone's understanding of media economics better.

So it came as a shock to hear that Barry, 59, died Dec. 26 after battling cancer.

Barry was one of the first classically trained economists devoted to understanding producers of and audiences for newspapers, television broadcasts, and film. You cannot call yourself a student of media economics if you don't know his work.

Barry and a doctoral student completed the first study linking the quality of news to the financial performance of newspapers.1 He later helped update the fundamental model of newspaper competition developed in the 1970s to reflect three decades of changing technology and markets.2 He then took an overused, ill-defined buzzword -- convergence -- and gave it meaning by showing how people select news from different media based on differences in characteristics like speed of delivery, convenience, and quality.3

Barry developed a model predicting what will happen if people can't get reliable information from the media about urgent topics like birth control, showing they will instead assemble an understanding from whatever sources they can find.4

He identified a major flaw in the long line of studies examining diversity or its absence in media content, refuting the underlying assumption that there is an unlimited demand for diversity.5 Barry offered a more realistic model showing that the desire for diversity is balanced against the desire for other characteristics of content, always within the limits of available time for reading, watching and listening.

Barry helped examine the creation of the Fox network, showing how a confluence of regulatory and economic factors made possible the enormous gamble for News Corp.6 The study is a valuable reminder that what now looks like a taken-for-granted success was anything but that at the time. In another study, Barry and his co-authors showed why networks prefer programs that are predictable, making truly innovative television the exception, a finding that holds up well in the cable universe.7

Barry was a professor at Michigan State University for more than 30 years, one of a handful of faculty who made the College of Communication Arts & Sciences the center of gravity for understanding media economics.

This spring, as always, I will teach a graduate course where Barry's work appears multiple times. I like to quote Barry because it always makes me sound smart. This semester won't be nearly so much fun. Mostly, I'm going to think about what we've all lost.

Barry's obituary is available here, and an announcement from the college can be read here. A Facebook page to post memories of Barry can be found here.


1Litman, B. R., & Bridges, J. (1986). An economic analysis of American newspapers. Newspaper Research Journal, 7(3 spring), 9-26.

2 Bridges, J. A., Litman, B. R., & Bridges, L. W. (2002). Rosse's model revisited: Moving to concentric circles to explain newspaper competition. Journal of Media Economics, 15(1), 3-19.

3 Litman, B.R. (2006). The convergent society and the media industries. In Bridges, J. Litman B. R., &Bridges, L.W. (Eds.), Newspaper competition in the millennium (pp.23-32). New York, Nova Science Publishers.

4 Litman, B. & Bain, E. (1987). Information search and banned product advertising: An indifference curve approach. Current Issues and Research in Advertising, 39-59.

5 Litman, B. R. (February 1992). Economic aspects of program quality: The case for diversity. Studies of Broadcasting, 121-56.

6 Thomas, L., & Litman, B. R. (Spring 1991). Fox Broadcasting Company, why now? An economic study of the rise of the fourth broadcast "network." Journal of Broadcasting and Electronic Media, 35(2), 139-158.

7 Litman, B. R., Shirkhande, S., & Ahn, H. (2000). A portfolio theory approach to network program selection. The Journal of Media Economics, 13(2), 57-79.